
BACKGROUND: Patients with severe illnesses often develop muscle atrophy, which often affects their clinical course. In the general aging population, muscle atrophy, as recently called sarcopenia, is considered to cause health problems. The full mechanisms behind these pathological states of muscle atrophy remain to be clarified. Therapeutic approaches for treating muscle atrophy have been limited. Measurement of changes in the skeletal muscle mass can be used as an indicator of illness recovery or aggravation, and of alteration in the health status of patients. Evaluating muscle atrophy precisely by morphometric analyses on histological samples has been, however, difficult, due to the heavy workload of counting the size of muscle cross-sectional area manually and analyzing the data. Thus, we have set up a streamlined system for the whole sectional image capturing, analyzing with a cutting-edge deep learning-based method, and processing it via image J-based program. In this presentation, I would like to show the versatility of this method by comparing the manual counting and automatic counting method.
METHODS: Skeletal muscle samples from various disease models were harvested and snap-frozen. The tibialis anterior muscle samples were cryosectioned, and immunofluorescently stained against skeletal muscle membrane markers (laminin and caveolin-3). The whole tissue was scanned using a fluorescent microscope, and images were reconstituted into the entire cross-section of the muscle. For the manual section analyses, the resulting image was transferred to iPad (GoodNote5), and the boundary was traced using Apple Pencil. The trace was then fed into Image-J for image segmentation for boundary detection, particle analysis and section size quantification. For the automatic method using Deep-Learning using Cellpose, the reconstituted images were fed into the software, and cell boundary was detected via web-trained AI-basis. Finally, the two results were compared.
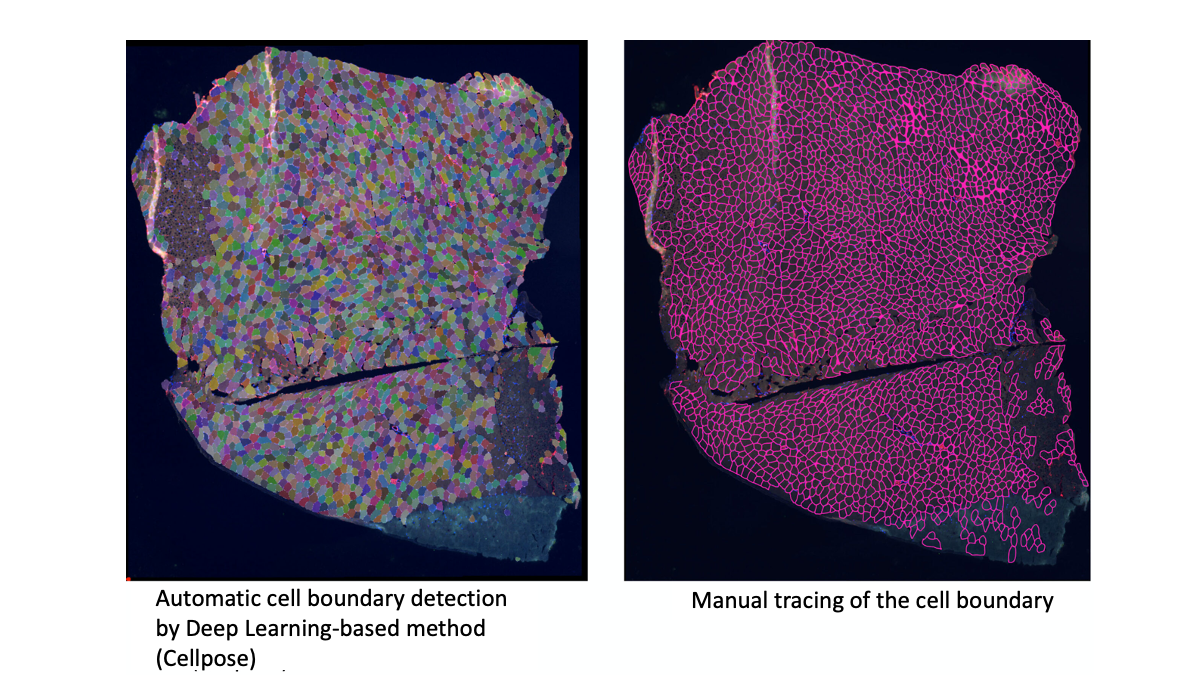
RESULT: Manual detection of the cell boundary was successfully conducted. The distribution of muscle cross-section showed bi-phasic distribution with roughly two peaks of the relatively large- and small-sized cell populations. The difference in the patterns of void areas, between the actual muscle cells and the connective tissues (and blood vessels) can feasibly be distinguished. With the automatic method, the cell boundary was equally successfully detected. Some of the connective tissue areas were mistakenly recognized as cells, but most detection faithfully matched those from the manual method.
CONCLUSION: Both manual cell boundary detection methods and the Deep-Learning-based automatic method provided precise cell boundary detection, whose quality was good enough to be fed into the analysis software. Considering the time consumed for analyses (manual method: >2days, vs. automatic method: 10minutes), the new method is considered robust and time-saving in analyzing muscle atrophy of various samples.
December 28, 2025